Is politics a load of smoke and mirrors? Is democracy on the brink of collapse? Does your vote matter at all in the electoral college? I know I don’t have a good answer for any of these questions, but I do know that a healthy wager or two could be placed on any of the aforementioned topics. In good old American fashion, if there’s intrigue, there’s a betting line. Time for me to step in and see if I can beat the House (not the one of Representatives)
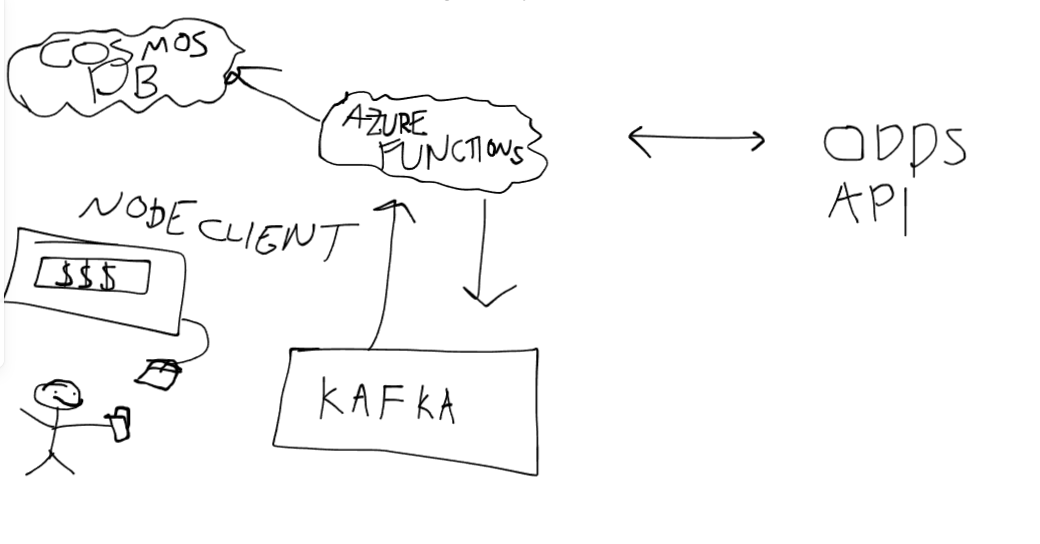
What I’d like to do is see how long it would take to set up some foundational infrastructure for streaming real time odds of any and all wagers. Seeing as the temperature is cranking up for the Oval Office in 2024, what better place to start than with political betting lines. At a high level, I’m going to use Serverless code to scrape odds from an online source. I’ll then publish these odds to a kafka topic correlated to the betting markets in question. I’ll use separate code to pull from these topics and then visualize these odds within a simple client. It’s like an infinite money glitch, see below:
 |
|---|
| As you can see, that is me. I am making loads of money. Its so smart |
Get into the repo, create your terraform resources and start to run your code. Unfortunatley, I haven’t set up enough of the confluent terraform resources (shoot), so you’ll need to follow their Getting Started Guides and fire up a new environment. For today, we’ll skip the schema enforcement and the schema registry steps for Kafka. Obviously, this is of the utmost importance within production systems. Seeing as there is only my own money on the line in this setup, the stakes aren’t as high (sarcasm). This is just about all the code you’ll need to interact with a Kafka cluster and start publishing metrics, it’s pretty sweet:
from confluent_kafka import Producer
from kafka_utils import read_ccloud_config
producer = Producer(read_ccloud_config("secrets/client.properties"))

producer.produce("suchacooltopic", key='keeeey', value='valllllue'
producer.flush()
Once the data resources are created, you’ll need to run the data.py file. In there, we have a generic model for the SQL table of market_data. This’ll house some odds for the observation we’re currently looking at. We’ll use a primary key of (data_id, and timestamp) to make sure that we are tied in on a lines performance over time. By creating these resources in the database, we’re setting our consumer up to have the easiest time. We’re using SQLAlchemy as our ORM, it’s one of the best out there and is very widely used, here’s all the code we’ll need to create our models:
from sqlalchemy import Column, Integer, String, Float, DateTime
from sqlalchemy.orm import declarative_base
from sqlalchemy import create_engine
import os

Base = declarative_base()

class MarketData(Base):
    __tablename__ = "market_data"
    data_id = Column(Integer, primary_key=True)
    name = Column(String(250))
    image = Column(String(250))
    market_image = Column(String(250))
    price = Column(Float)
    buy = Column(Float)
    sell = Column(Float)
    timestamp = Column(DateTime(timezone=False), primary_key=True)
    market_id = Column(Integer)
    market_name = Column(String(250))


    def __repr__(self):
        return "<MarketData(name='%s', market_name='%s', price='%s')>" % (
            self.name,
            self.market_name,
            self.price,
        )

if __name__ == '__main__':
    conn_str = os.getenv('CONN_STR')
    engine = create_engine(conn_str)
    Base.metadata.create_all(engine)
Once we get things all hooked up, we’re off and running. By publishing metrics to our topic, we’re later able to consume them precisely and visualize them. What’s nice about this setup is that we’re ostensibly leaving room for large amounts of scaling in the future. If we need separate business logic to consume separate odds, we’re able to do so through separate functions consuming separate topics. If you let your mind run wild, you can imagine all the money you could win by gambling even MORE. Taking a look through Rapid API, there are some great sports related candidates for future integrations.
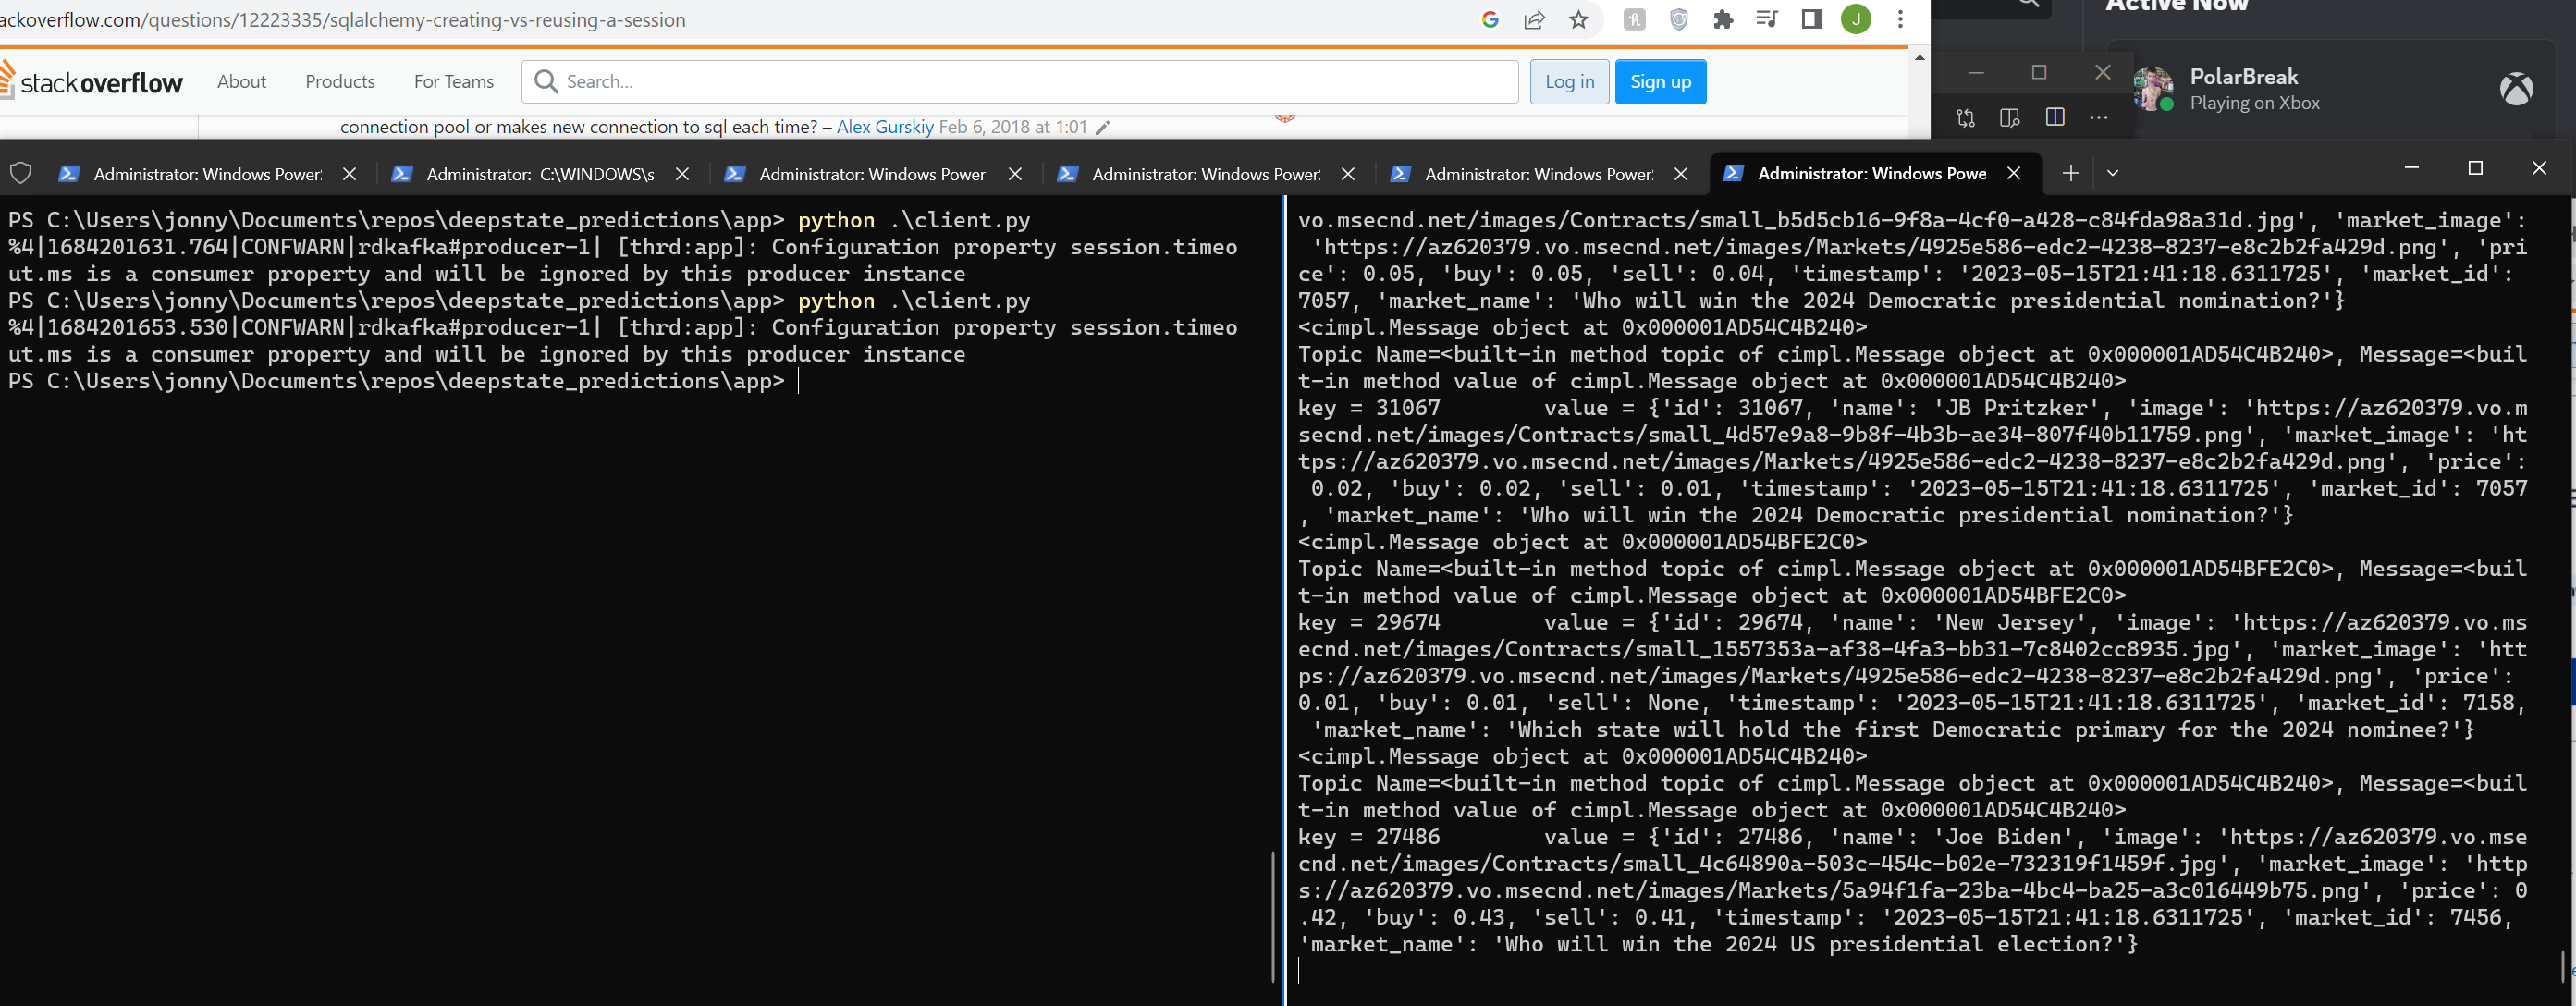
A quick note for duplications sake, we’ll need to dedupe the odds as to not overwrite items into our DB. Pretty simple stuff. Once we’ve got things up and running, the logs should look like this
 |
|---|
| Split console goes brrrrrr |
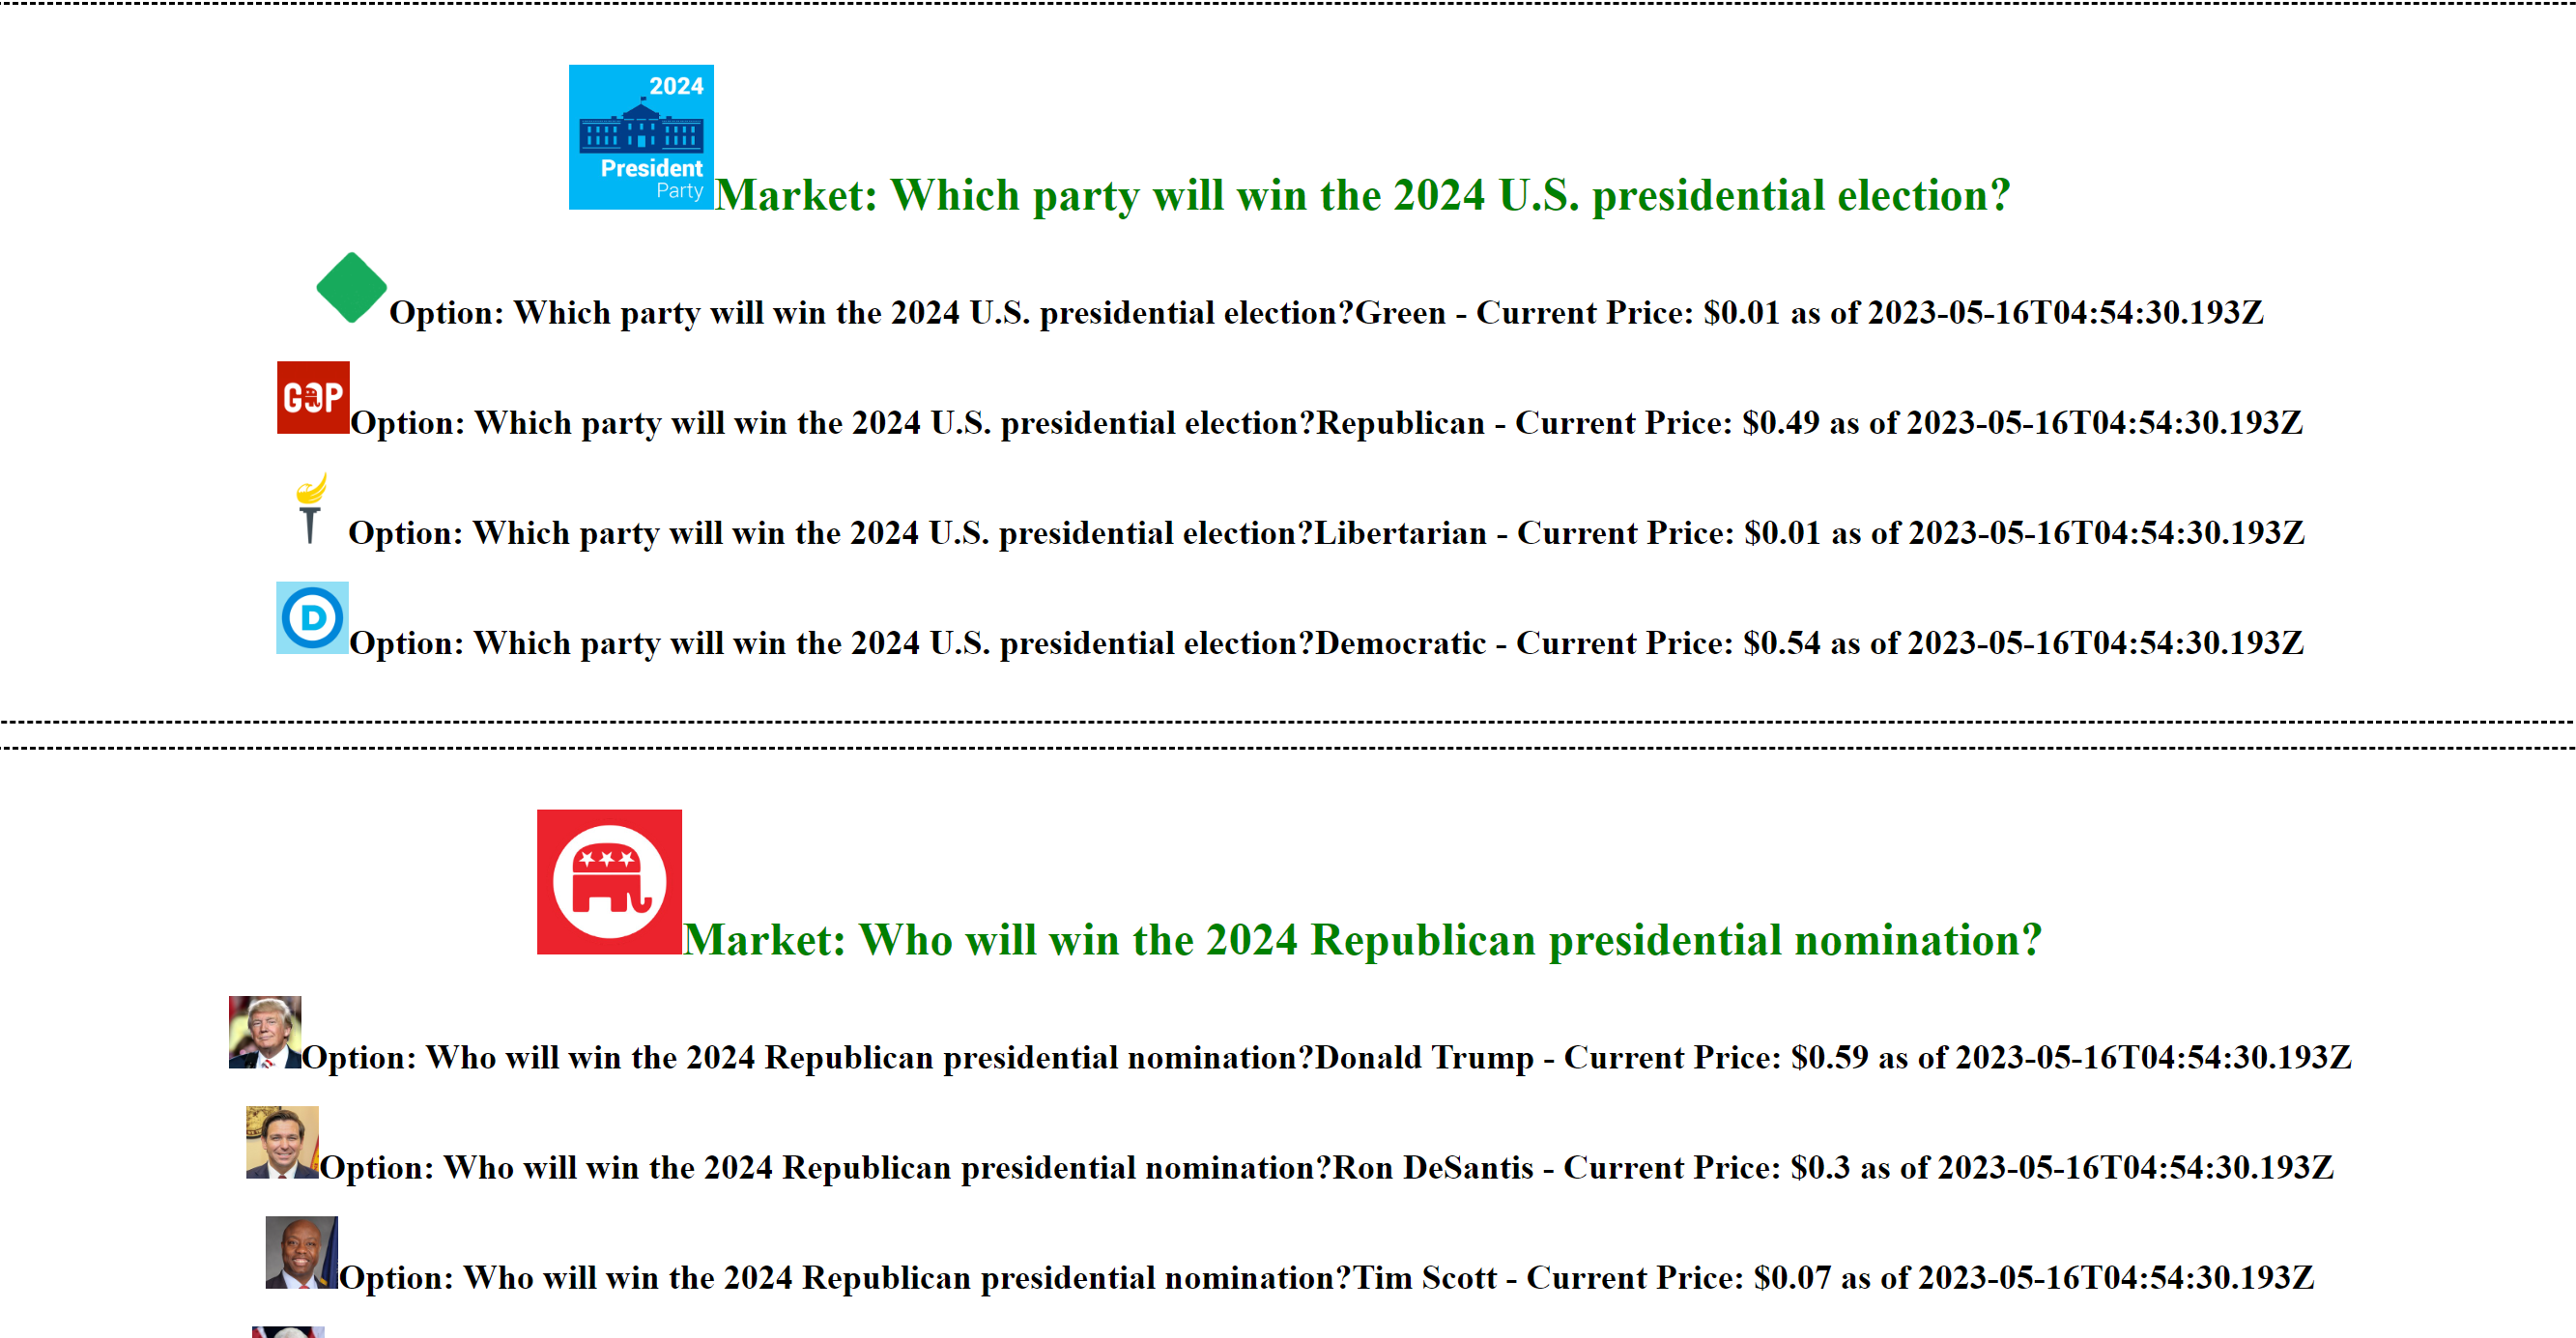
Pretty epic, let’s then look at how we can visualize this with a basic client. By simply querying the database, we can propagate the results up to the end user. Really simple Node endpoints can be created to surface this to a user and then we can visualize the results in React.
app.get('/api/getData', (req, res) => {
    pool.query(`
    SELECT
    t0.market_name,
    t0.name,
    t0.price,
    t0.timestamp,
    t0.market_image,
    t0.image
    FROM market_data t0
    JOIN (
        SELECT data_id, MAX(timestamp) as max_ts
        FROM market_data
        GROUP BY 1
    ) as t1 on t1.data_id = t0.data_id and t1.max_ts = t0.timestamp
    `, (error, results) => {
    if (error) {
      throw error
    }
    res.send(results.rows)
  })
});
 |
|---|
| I am officially a product designer |
Outstanding! Currently, we’re just gonna visualize the most recent odds, to give us an up to date view of the political landscape. However, we could very easily gather loads of data from the server and do a visualization of the changing odds over time with tools like Recharts
You might be wondering, “Jonny, you sage man, which of these lines are going to make me some scratch? I need me a summer vacation in Aruba!” I hear you, my good man. As of today (5/17/23), the prompt Which state will hold the first Democratic primary for the 2024 nominee? is trading at .58 for South Carolina. That is what one might call a total lock. All eyes are set on a change of pace to give Biden momentum with strong numbers against his opponents of Marianne Williamson and RFK Jr. Outside of that, I have no idea what’s going to happen. But this is where the bread is buttered folks, periphary lines are where the true value lies.
More iterations on this to come, there are odds to be scraped, and I will scrape them.